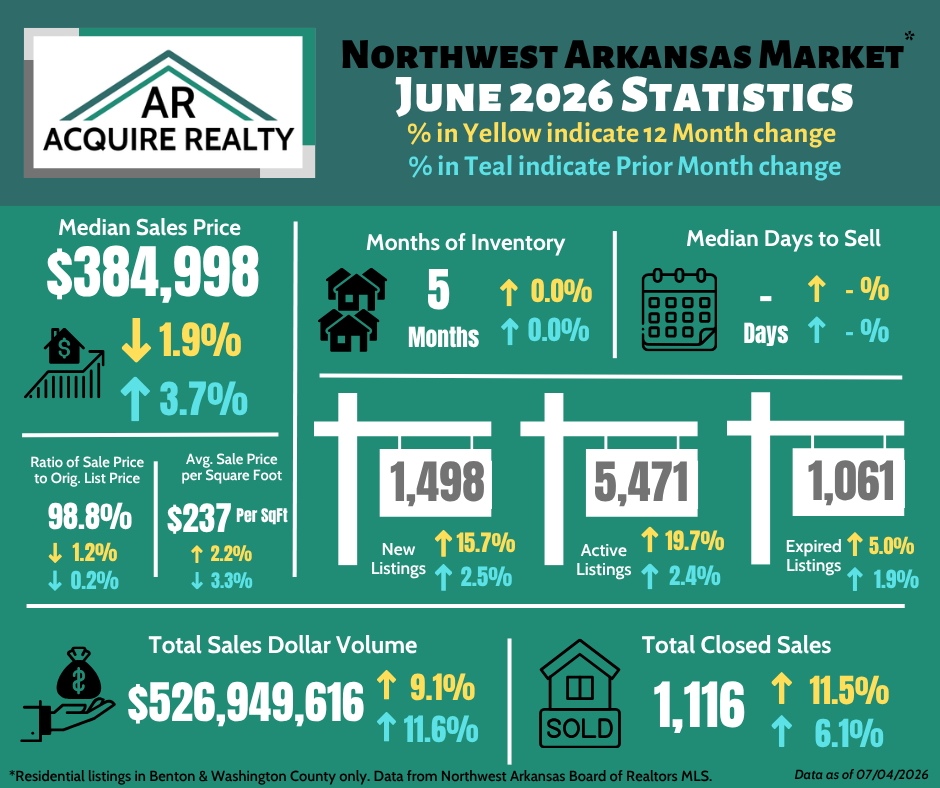
Last month was the first time that residential sales in the NWA MLS for Benton & Washington counties alone surpassed HALF A BILLION DOLLARS in closed properties! Evidence the NWA market is very strong.
A general assessment of June is to say that activity was up. New Listings, Active Listings, Expired Listings, Total Sales Dollars, and Total Closed Sales were all up; both for 12-month changes and 1-month changes. Active listings was the highest it has been in the past 10 years. (It might even be the highest ever, but our database only lets us pull 10 years back.) This is likely the result of historically and projected strong population growth in NWA.
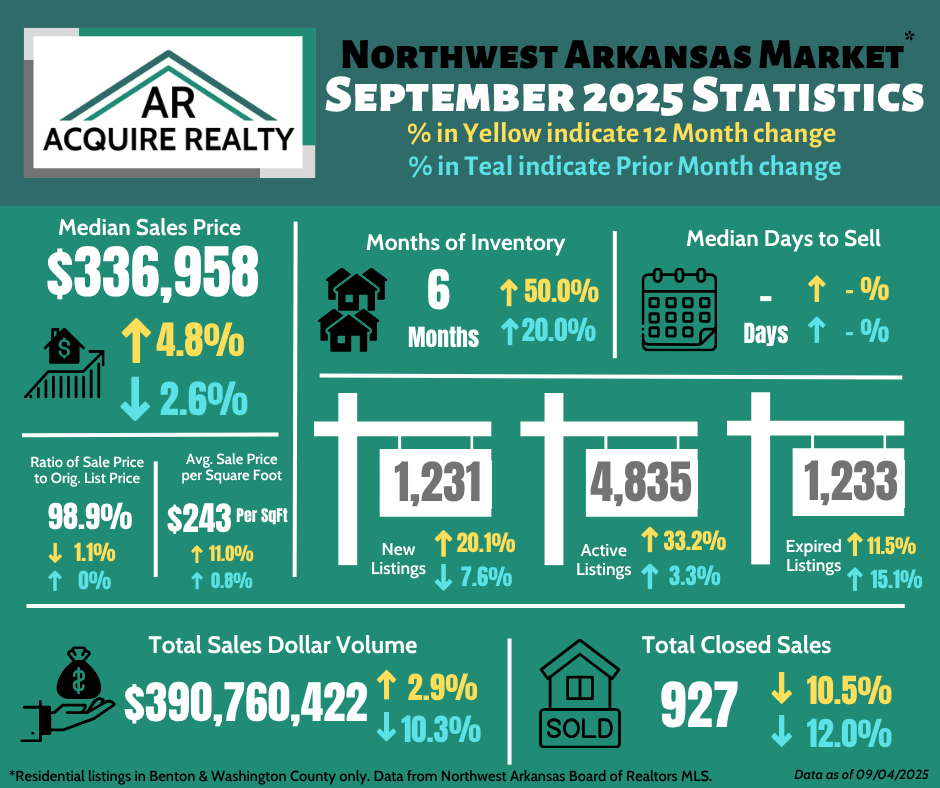
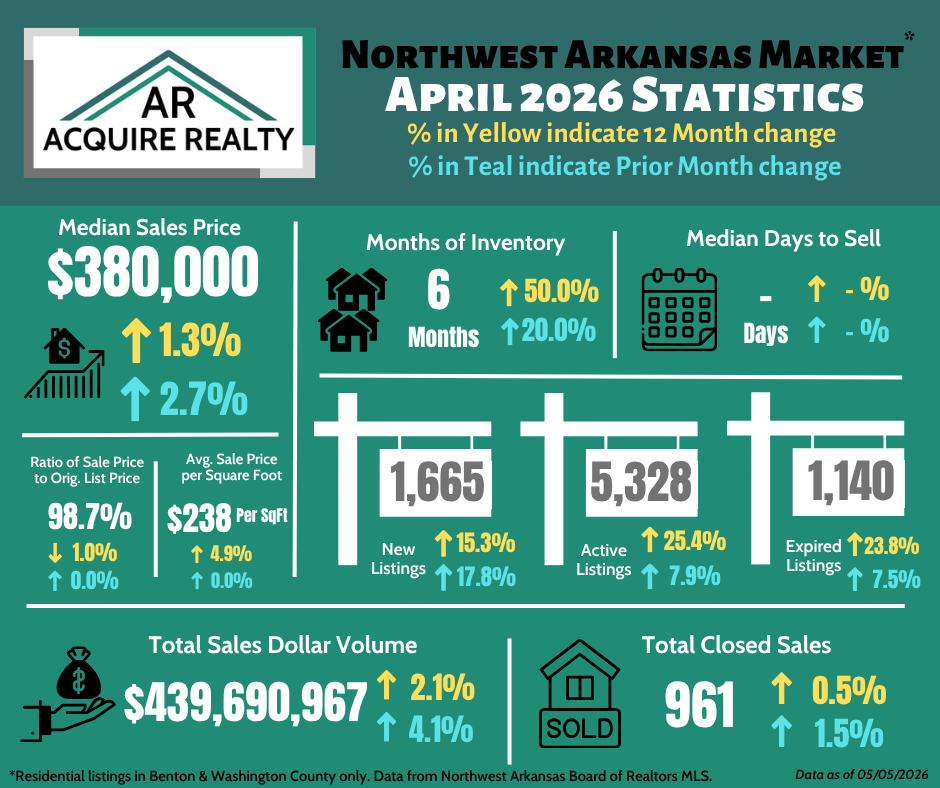
While activity was up, prices were not. The last 2 months were the first May and June since before Covid that the ratio of sold price to original list price was below 100% (2019 with 99.7% and 99.1%, respectively). Meaning even though we were in the peak selling time of the year, sellers (still testing new market highs) are having to make slight concessions in the purchase price to find a buyer. This was also the first back-to-back months when the 12-month percentage change in median sales price was negative (May -1.3%, June -1.9%). That is, this May and June had median sales prices were less than the median sales price for the same months in 2025. While both were less than a 2% decrease, it is a sign that the median sales price of a home in NWA is not continuing the consistent rise we saw in 2020 to 2024. This is a welcoming note for buyers trying to save for a down payment. Median sales price has hovered around the $370K to $385K range for most of the last 12 months. One interesting note (and more proof the NWA market has seen median sales price increase very consistently the last 10 years), June was only the fourth month in the last decade that the median sales price was less than the year prior (May 2026 -1.3%, March 2024 -1.7%, August 2018 -0.9%).
We wish we had more useful information about the median days to sell, but our system is still reporting this metric incorrectly. The system says the median days on market was 21 for June, however this would be more than 2 times faster than the pace homes sold during peak pandemic activity; when it was around 44 days. There is no way this is the case, which is why I choose to continue to not publish that statistic.
The big take away: Overall NWA is still a very healthy market with good activity and prices are holding in a reasonable range; allowing us to avoid the big swings of either buyers or sellers having too large of advantage over the other.

.png)