


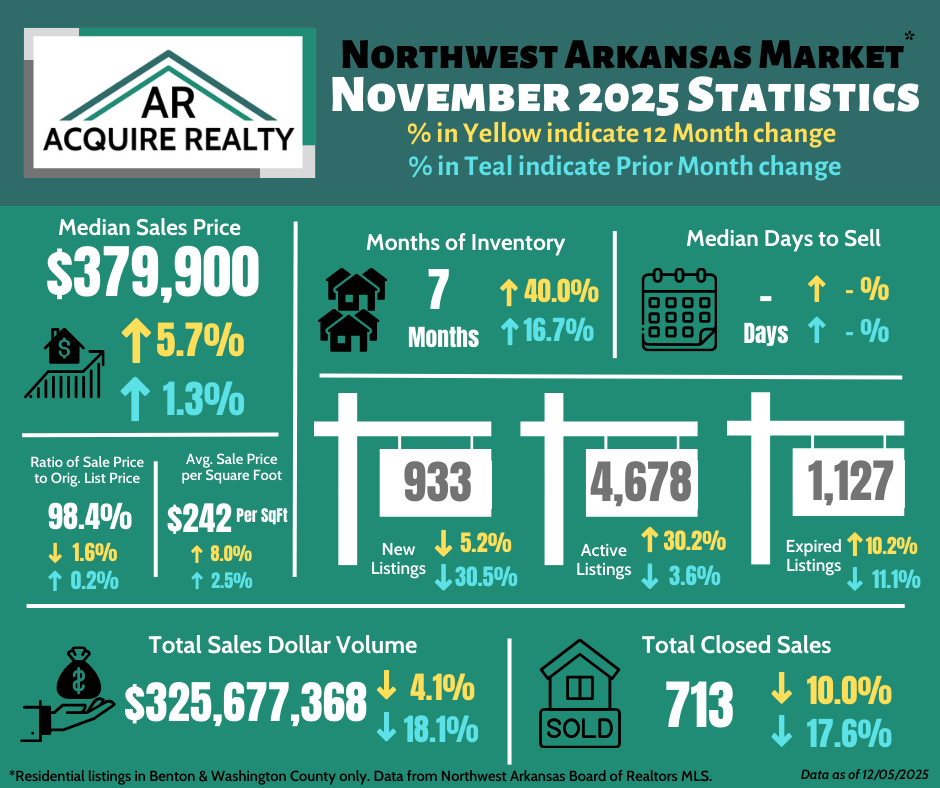
We’ve reached November and sales were down….is it surprising or just seasonal? Let’s talk about it.
Signs of seasonal changes:
➡️ From October, total sales by dollar and by count decrease 18.1% and 17.6%, respectively. These decreases are within the range of similar percentage decreases for prior Novembers.
Signs not explained by seasonality:
➡️ Months of inventory rose by 1 in November. Seven months of inventory is the highest it’s been in almost 7 years (January 2019). That means the pace sellers are entering the market increased relative to the pace buyers are closing on properties. We’re still in a seller’s market, but as the months of inventory inches higher, we transition into a buyer’s market. As a rough rule of thumb, a months of inventory close to 12 is often considered to start of a buyer’s market.
➡️ Interesting to see expired listings 12-month and 1-month changes diverge, meaning one positive and one negative. But even more interesting is they diverging with double-digit changes in both. And even more interesting than that is the fact that both the 10.2% increase from Nov 2024 and 11.1% decreased from the month prior are the largest changes for both metrics for any November in the past 10 years.
➡️ This makes the 6th consecutive month that the 12-month change in active listings as increased more than 20%. In fact, 4 of those 6 months have been greater than 30% increases. We haven’t had a 12-month change in active listings greater than 21.7% in the last decade. So, 6-consecutive months higher than that is saying something. Houses are sitting on the market longer. We may have been increasing the number of new listings year to year, but this year has seen larger increases than years past. If the days to sell statistic was working correctly in our MLS, we would have more insights on just how much longer homes were taking to sell.
➡️ While it is not uncommon to see the number of new listings reduce during the winter months, the 30.5% decrease in 1-month change of new listings is the second largest percentage decrease in 1-month change for new listings in more than a decade (April 2019 higher at -36.2%). The mystery is why are significantly fewer owners choosing to sell? Perhaps the bulk of the equity-rich owners have sold their homes that were going to, and new sellers are holding tight to see what the future entails. Who knows.
The thing we take away from all of this is when multiple statistics are the first or largest of something in more than a decade it is hard to say things are the same old, same old. I can’t say it’s the beginning of a large shift, because everyone should know a sample size of one doesn’t make a trend. We’ll have to keep an eye on it to see if a trend does forms. Time shall tell.