Area Real Estate News & Market Trends

You’ll find our blog to be a wealth of information, covering everything from local market statistics and home values to community happenings. That’s because we care about the community and want to help you find your place in it. Please reach out if you have any questions at all. We’d love to talk with you!

Sept. 6, 2025

August 2025 Market Updates - Northwest Arkansas

Latest NWA Market Statistics!!

The most interesting thing about this month’s statistics doesn’t have anything to do with the market…there was an error in the calculation for Days on Market for the entire MLS for the month of August, so you will see there is no statistics for Days to Sell this month. I have been told this will be fixed next month.

Overall, the month of August is what we see in general for this time of year. A slight slowdown from the typically more active spring and summer months. Even at that, most had percentage decreases in the lower single digits.

The number of active listings inched up 0.4% from July and expired listings was only up 0.5%. If the market was seeing significant shifts and becoming a buyer’s market, these should be increasing quickly. And the rate of changes in the increases should also be increasing (picture a graph that looks like the right half of a “U”) instead of slowing (picture a graph that looks more like the top half of a “C”).

August had the first decrease in 12-month change in total sales dollars in 16 months. And total sales (both by dollar and by count) had the largest percentage decrease in 2 years. This may be a sign that perhaps the market as a whole is slowing, but not who has the leverage in a transaction. Meaning, the ratio of active buyers to sellers is staying consistent with prior rates in prior years. Months of Inventory is still in the 3-6 range where it has been for the last 6 years. Both are indications it is still a seller’s market.

These are the key takeaways for August in NWA. The residential market is still doing well, but we’ll be keeping eyes on it as always. If you have any questions, reach out!

Aug. 4, 2025

July 2025 Market Updates - Northwest Arkansas

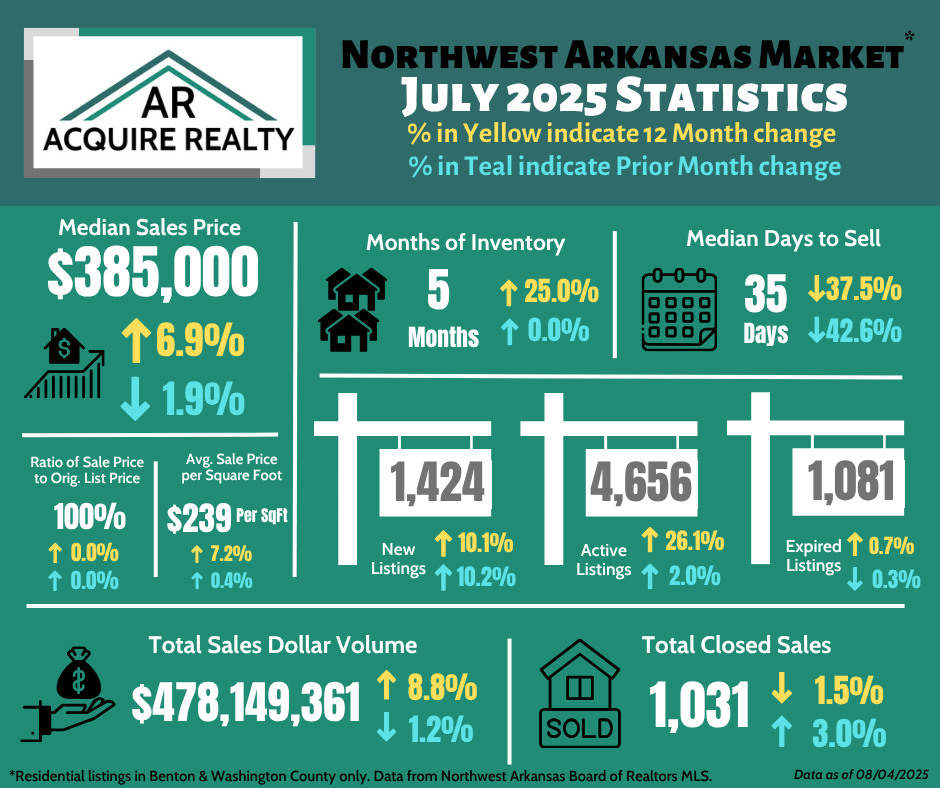
July was another strong month for NWA! 😎

From a pricing standpoint, sale price patterns are staying relatively consistent; with single digit percentage increases in 12-month changes and marginal increases in 1-month percentage changes. Interestingly enough, only 1 time in the last 55 months has the 12-month change decreased for price per square foot (May 2024, -2.28%) and median sale price (March 2024, -1.68%). Proof the market is increasing as a whole year-over-year.

In terms of listings in the market, the 26.1% jump in 12-month change for active listings is a relatively large increase in Julys in the last 5 years, but the 1-month change is still right in line with Julys of previous years. You might question if this is a small sign that sellers are having a harder time finding buyers, but that doesn’t seem to be the case with months of inventory staying in the 4 to 5 months range consistently. We would use days to sell to help form the analysis, but we think the July days to sell is incorrect. According to the NWA MLS data, the median days to sell was 35 for July. We suspect there is an error in the data somewhere. This would mean there was a 42.6% decrease from last month in days to sell (meaning buyers are all the sudden moving very fast which we haven’t seen any anecdotal signs of), and seems unlikely. We would expect us to be in the high 50’s or low 60’s days given we have been above 50 days to sell since Feb of 2023. In fact, 34 days to sell would be the lowest in the last 10 years; including the very fast-pace COVID times. We think there will be a correction in the data next month.

Over market sale was in line with this time of year; with only single digit percentage changes in 12-month and 1-month changes for total sales volume and total closed sales. If we are looking for signs of market slow down, both of these numbers would be slumping. We’ll continue to remain optimistic, but always monitoring for signs of market changes.

July 5, 2025

June 2025 Market Updates - Northwest Arkansas

⭐️⭐️June Market Statistics Updates!⭐️⭐️
 
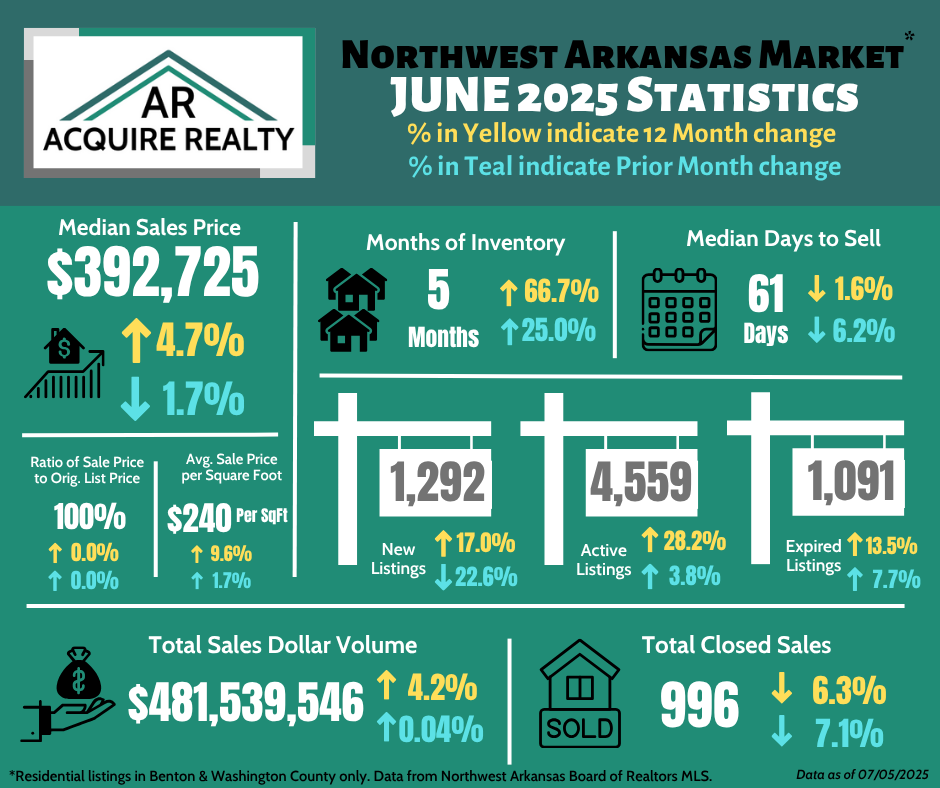
June was almost a rinse-and-repeat of May. That’s a good thing. Most metrics were up; signs of a continuing strong residential market in NWA.
 
The one thing of note from last month, new listings were down 22.6% from last month (350+ listings) but still up 17.0% from same time last year (~300 more). This is not atypical for this point in the year. The last 2 year the new listings in the month of June was down from May; a common inflection point in the pace of market activity.
 
Median sales price was down only slightly from last month. But to illustrate the consistent growth of home prices in NWA, only 1 time in the last 4 years has the 12-month change in median sales price decreased (May 2023, down 1.2%). This is a clear sign that the prices in NWA have continued to climb year-over-year.
 
One final point, the number of active listings was up 28.2% from June last year. Could be a sign of market slowing, but the fact that the months of inventory is consistently in the lower single-digits, shows we are still in a strong seller’s market.


June 4, 2025

May 2025 Market Updates - Northwest Arkansas

Everything is UP! 📈⬆️

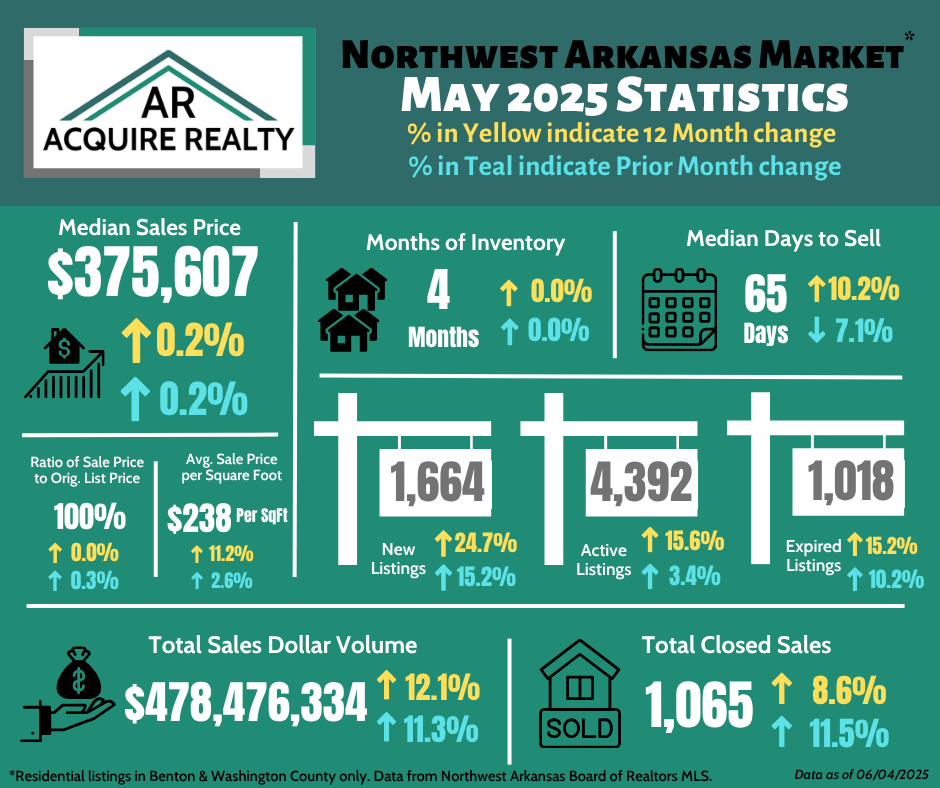
This is the first market update post in which only one of the tracked statistics had a decrease in either the 1-month or 12-month changes. But is that a good thing?? Let’s talk about it…

As a reminder, these numbers only reflect the transactions that occurred in Benton and Washington County; which accounts for 87.6% of all closed dollars in the Northwest Arkansas MLS (about 8 out of every 9 transactions).

The median days on market change from April to May is the only metric that saw a decrease. However, that is generally considered a good thing because that means houses are taking less time to find a buyer. Interesting note about days on market, we have seen a slight decrease each month for the last 3 months (as expected) as we enter spring, but all of those months have been higher than their corresponding month 1 year prior. Meaning, we’re seeing the typical springtime market activity up-tick, but thus far, 2025 sales are taking more days to sell then 2024.

Perhaps that could be a sign of less buyers in the market than last year, however, months of inventory has stayed the same; an indicator that the pace of active listings to closed listings is holding steady. In order for that to be true and given that new and active listings have increased in 2025 vs 2024, the number of buyers in the market has to be increasing at the same rate. So, in this case, a higher day on market is more likely a sign that buyers are writing offers with longer closing dates, since the “quick close” (popular in the peak covid-mania days) isn’t the term that sellers currently care about most.

In terms of pricing inflation, home prices are seeing a slight increase on average, but no drastic changes as the median sales price has held pretty steady for the last few months. This is a good thing for buyers trying to plan for home purchases.

Overall performance, the total number of closed transactions increased by more than 100 transactions from last month, accounting for the almost $50M more in sales volume. This was still a very solid month for the NWA residential real estate market.

May 5, 2025

April 2025 Market Updates - Northwest Arkansas

The Latest Numbers for NWA!!


First, we’re making a subtle change…. We will now publish the market statistics using data from only Benton and Washington counties. In recent months, our local MLS has incorporated multiple smaller MLS networks. That’s great for agents and the public having access to even more information. However, many of these smaller MLS’s are in outlying area with lower priced homes and closings occurring slower than the main NWA metro, and begins to distort the numbers for the highest demand areas in NWA. Most people think they are getting info about these 2 counties only anyway when they are reviewing the market update posts. As my goal is to provide the most critical information for the most clients, we are making the change. We will now only report the metrics for Benton and Washington County; which currently accounts for ~70% of all closed transactions and ~80% of all closed dollars in the Northwest Arkansas MLS. With that, comparing prior market update posts with future post is not comparing the same sample groups and thus should be interpreted independently.


April was the first time active listings were over 4000 in almost 7 years (July 2019 at 4,088). The 12-month changes in active listing have increased the last 31 consecutive months (Sept 2022 last negative 12-month change with -2.8%). Last month had the largest 12-month percent increase in 2 years (April 2023 at 20.3%). In terms of new listings, April had the highest number of new listings in the last 10+ years. In fact, only one other month in the past 10 years has had 1400+ new listings (May 2018 with 1,415).


One other change with this market update is the average sales price per square foot is no longer available; only the current price per square foot is available. The difference is subtle, but “current price” includes unsold properties which (in my opinion) is not a fair reflection of the market. Anyone can list a property for sale for any price they want regardless of “fair market value”. Using the “sale price” metric is important because it is a better indicator of what the market is actually willing to bare. But given “current price” is the only data available, we will proceed with this metric until (hopefully) the “sale price” returns. That said, April 2025 saw the highest per square foot price ever at $234/SQFT! That’s a $15/SQFT increase (6.9%) from April of last year. Interesting also to note price per square foot has only had one month with a negative 12-month change in the last 64 months (May 2024, -2.3%).


In April, Benton and Washington counties tied the record high for median sell price with $375,000 (July 2024). The rising market values in this area have been so consistent only one month in the last 80 consecutive months has had a negative 12-month change in median sales price (March 2024, -1.7%).


Total sales by dollar and by count was up about 5% from March. However, it’s interesting to note the 12-month change in total sales by dollars was up 11.4% while the 12-month change in total sales by count was only up 0.6%, meaning a lot more expensive homes sold this April as compared to last April; accounting for most of the $43M more closed dollars.


All of these pricing related statistics are indicators of the strength and consistency of the NWA market. While the value growth continues, we do see indicators the overall market is returning to pre-COVID levels; where buyers and sellers were on a more even playing field. That’s not a bad thing for NWA.


If you want information about markets outside of Benton or Washington County, we welcome you to reach out because we are happy to look into whatever we can.
 

April 4, 2025

March 2025 Market Updates - Northwest Arkansas


⭐⭐ NEW MARKET STATISTICS ⭐⭐
Before digging into the newest market statistics for NWA, it is important to first note, a smaller, outside MLS has been incorporated into the Northwest Arkansas Board of Realtors (NABOR) MLS system as of last month. A similar situation that occurred recently when the greater Harrison area was incorporated into the NABOR MLS.

Generally speaking, this new region adds an average of an additional 2,370 active listings, 140 expired listings, 140 new listings, 120 closed transactions, and about $23M more dollars in sales per month. The new area has lower priced homes, and thus decreases the overall median sales price of a house by about $11,600. That said, we caution readers from comparing prior market statistics updates with any future market statistics posts, as it is like comparing apples to oranges.

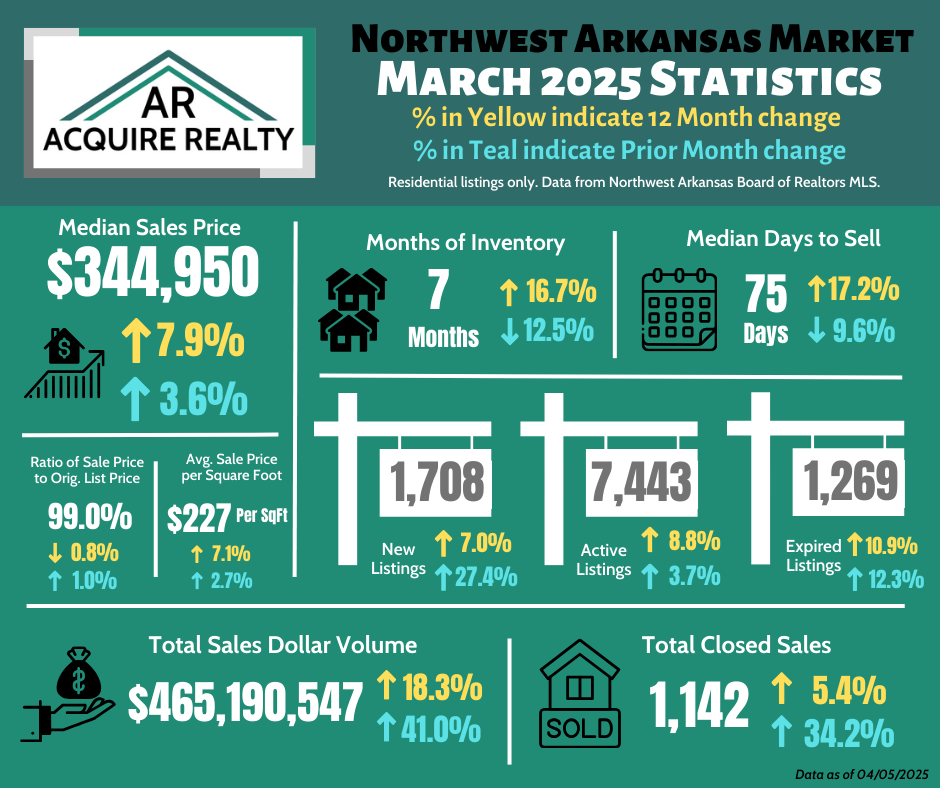
Now into the numbers for March 2025… It was another respectable month for the residential market in NWA. New listings increased 27% from February and the days on market went down by 8 days from last month. Both are typical signs that the market is waking up from the winter slow down.

The median sales prices and average price per square foot for a home was up slightly from last month; as well as, last year. The ratio of sales price to original list price was also up slightly from last month. All three of these statistics indicate sellers still have the upper hand in the market.

Total sales, both by count and by dollar amount, are up significantly from last month. That is, total sales volume was up 41% with $135M more closed dollars; and total number of closed transactions was up 34% with just shy of 300 more closings. Both of these metrics are also up from a 12-month change, showing there is still strong activity on the NWA residential market.

One final note to leave on. We have all heard chatter of recession talk. We resist predicting anything, but we will share a few insights on what we will look for from the data in future updates as signs of market slow down. We would watch for large decreases in the 12-month changes in total closed transactions; showing consistent underperforming of last year. We would also look for increases in months of inventory, days to sell, active listing, and expired listings; all signs fewer buyers are participating in the market. We would also expect to see the ratio of sales price to original list price decrease as sellers are forced to lower prices to find buyers.

That’s all for now. If you have questions about real estate (including commercial real estate) don’t hesitate to reach out!


March 6, 2025

February 2025 Market Updates - Northwest Arkansas

Latest NWA Market Statistics are here! 📊 📈

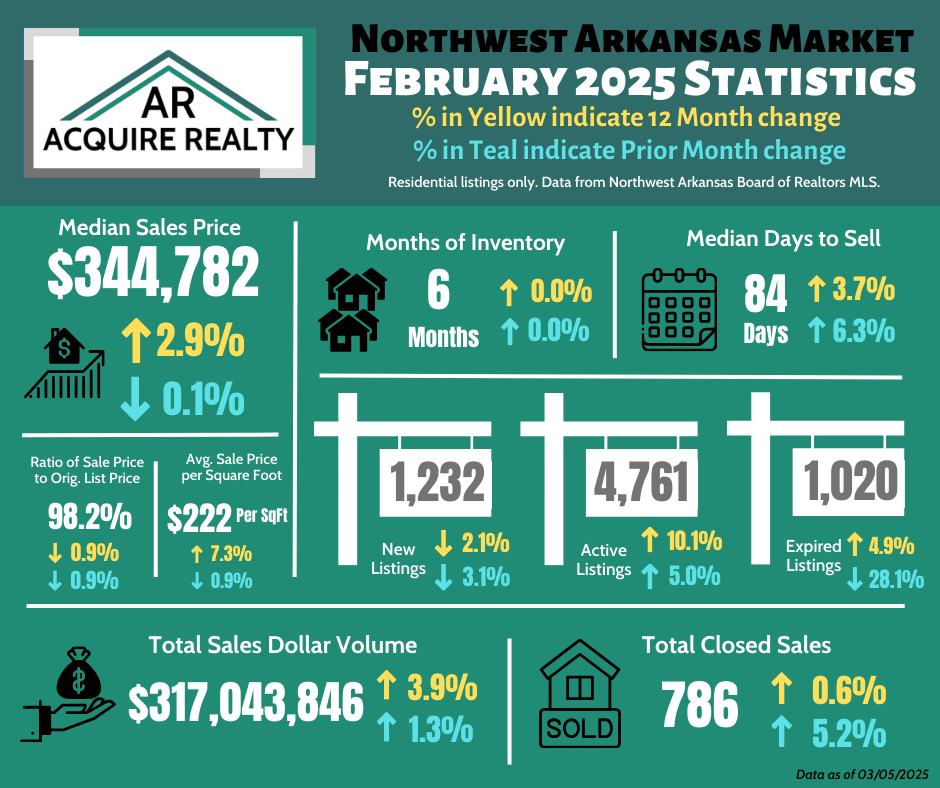
February was pretty calm overall for the residential real estate market. There was still good activity level for NWA without large fluctuations. In fact, the only 2 statistics with double digit changes were: 10.1% increase in 1-year change in active listings (more sellers this February than last year) and 28.1% increase in 1-month change in expired listings (less sellers “giving up” on the market).
The main things worth pointing out are:
--- > The median sales price was down only 0.1% (or $168) from last month. This metric has stayed between $344K to $346K for 4 of the last 5 months; a welcomed sign of consistency.
--- > This was the first time the ratio of sale price to original list price fell below 99% since January of last year (98.7%). Although the 98.2% ratio for last month is still an indicator sellers aren’t having to make large concessions yet.
--- > Median days to sell was 84 days for February. That is the highest in 6 years; back in February 2019 when it was 91 days. That dates back to pre-pandemic months. In fact, only 3 months during that 72-month span had median days to sell over 80 (Feb 2024 at 81 days, Jan 2020 at 80 days, and March 2018 at 80 days).
--- > Months of inventory held at 6 again for the second month in a row. This matches the same pattern for Jan/Feb of 2024; which were both 6 as well.

If we were to narrow the discussion of last month down to one thing, stability would be the theme. In inflationary and/or uncertain times, stability is a relief to have one less thing changing quickly under your feet. If you have any questions about anything real estate, reach out!


Feb. 4, 2025

January 2025 Market Updates - Northwest Arkansas

**January 2025 Market Updates**
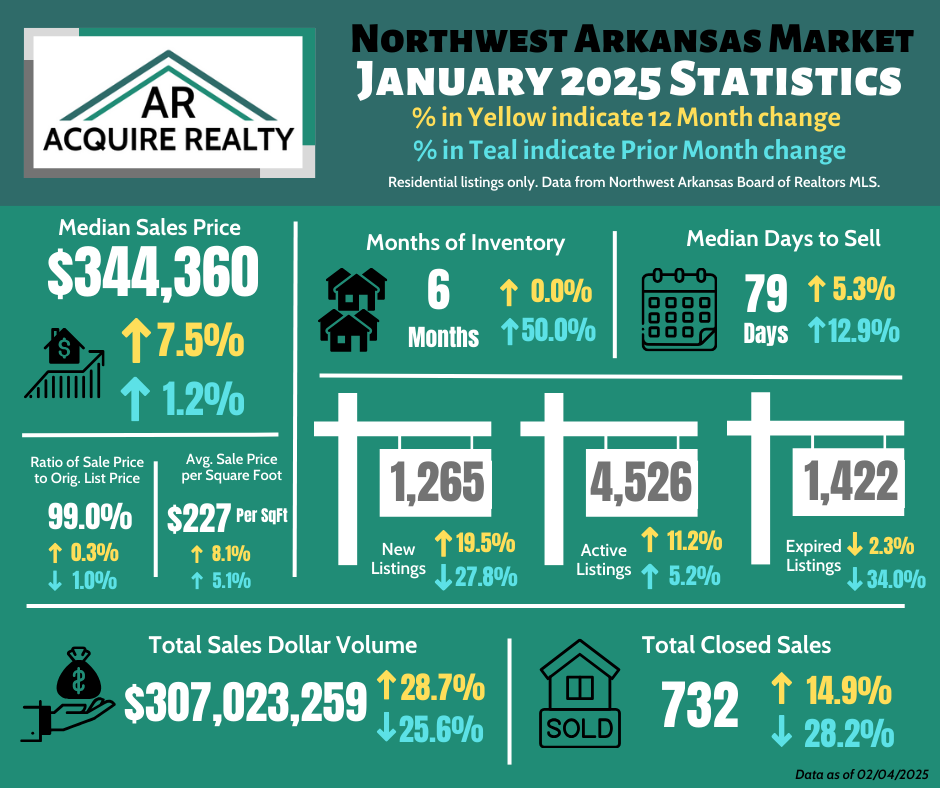
Expected the latest NWA residential market statistics to be boring as we’re deep in the slow winter months, but still found some interesting notes.

In general, January was slower than December but matched or out preformed January of 2024. Months of inventory rose from 4 to 6 in January, but it was still on par with January of last year.

Total sold volume was down $100M from December, but it was up $67M from January of last year. Just as the correlated numbers for total closed transactions with a 28.2% decrease from last month, but still had a 14.9% increase from the prior 12 months.

One interesting side note was to see how big a difference there was between the lowest month of sales last year at $239M in January, to more than double that in the peak month last year at $509M in June. That’s an increase of over $270M or 113%!

Looking a little more broadly at the data, you’ll see:

1) Every month for 2 years straight has seen an increase in the 12-month change for active listings. Another way to say this is January had more active listings then last January which was higher than the January before that. That’s also true for every month last year. This can be interpreted as, while seasonality of active listings is still occurring (more in summer, less in winter), the year-over-year on whole of active listings has increased. Not surprising as we’ve eased out of that fast-pace COVID market, a house stays on the market a little longer; meaning more overall active listings each month.

2) Average price per square foot has hovered in the $211 to $218 per SQFT range for the last 10 months. That’s a good sign of stability. January averaged $227/SQFT sale price. That’s an $11/SQFT increase (~5%) from last month. That was a little surprising since January tends to be a slow month giving buyers a little more leverage to negotiate down prices. We expect there will be a slight correction downward to this by the end of February.

3) If you want a simple snapshot of just how consistently prices have risen since the start of 2023, only one month in the last 2 years has not had an increase in the 12-month change in average sales price per square foot (May 2024). And only two months in the last 2 years has a decrease in the 12-month change in median sale price (April 2023 & March 2024). Both evidence that year-over-year, prices continue to increase.

That covers the key points for the latest market numbers. If you want to learn more about the market or have specific real estate questions, don’t hesitate to reach out!

Jan. 5, 2025

December 2024 Market Updates - Northwest Arkansas

Another solid month for the NWA residential market!!!

Closed properties were up from November; just shy of 27M more dollars sold or 72 more closed transactions (7% gain for both metrics).

Sold residential properties have hovered around $218/SQFT for the last 6 months, a sign of stabilizing prices. Another sign of pricing stability, the median sale price has stayed around $344K for the last 3 months. In fact, this is the smallest of any 3-month change in SEVEN years (Sep to Nov 2017).

The ratio of original list price to sale price was back to 100%; which was a little bit of a surprise because typically buyers have a little more negotiating power in the winter. 2021 was the last December to have a 100% original list price to sale price ratio.

Active listings were down from last month (not surprising with the slower winter months), but this was over 350 more active listings and 180 new listings than the same time last year (9% and 23% increase, respectively). Expired listings jumped in December from November (76%), because agents often write listing agreements to run through the end of the year. This jump is not a reflection that all the sudden less buyers are out there. Also evident by the months of inventory going down from 5 to 4; meaning new buyer activity is outpacing new seller activity in the market.

From an annual stand point, 2024 was more productive than 2023. There were 736 more closed residential properties accounting for the $475M increase in total closed dollars. This is good news as we begin another real estate cycle for 2025.

Dec. 4, 2024

November 2024 Market Updates - Northwest Arkansas

NEW MARKET STATISTICS! The seasonal winter slowdown is upon us, but it’s not doom-&-gloom. Here’s what the data shows us…

Signs of the Seasonal Slowing:
-> Active listings were down almost 200 (or 4.1%) from last month
-> New listings were down 240 (or 17.1%) from last month
-> Total sales for November 2024 was down 170 closed transactions or almost $75M from last month (15.7% and 17.4%, respectively)

Signs the Changes are Not Market Shifts:
-> Both metrics for total sales (dollars & count) are up from November of 2023. That is, the market is outperforming last year.
-> Expired listings were down 200 (or 14%) from last month. If there was a sign of overall market slowing, this metric should be picking up. Said another way, a market slowdown would see more listings not finding buyers and thus, an increase in expired listings
-> The ratio of original list price to sold price is still in the 99% range. Most sellers are not having to make large concessions to sell their property.
-> Median days to sell went down by 5 days from last month. Meaning, in general, residential properties sold faster in November than October; and sold slightly faster than the same time last year (by 2 days).

Given all of the latest data, it’s fair to say, NWA is reasonably were we should be for a healthy market in November. If you want to know more about the current residential market (or commercial), reach out!