


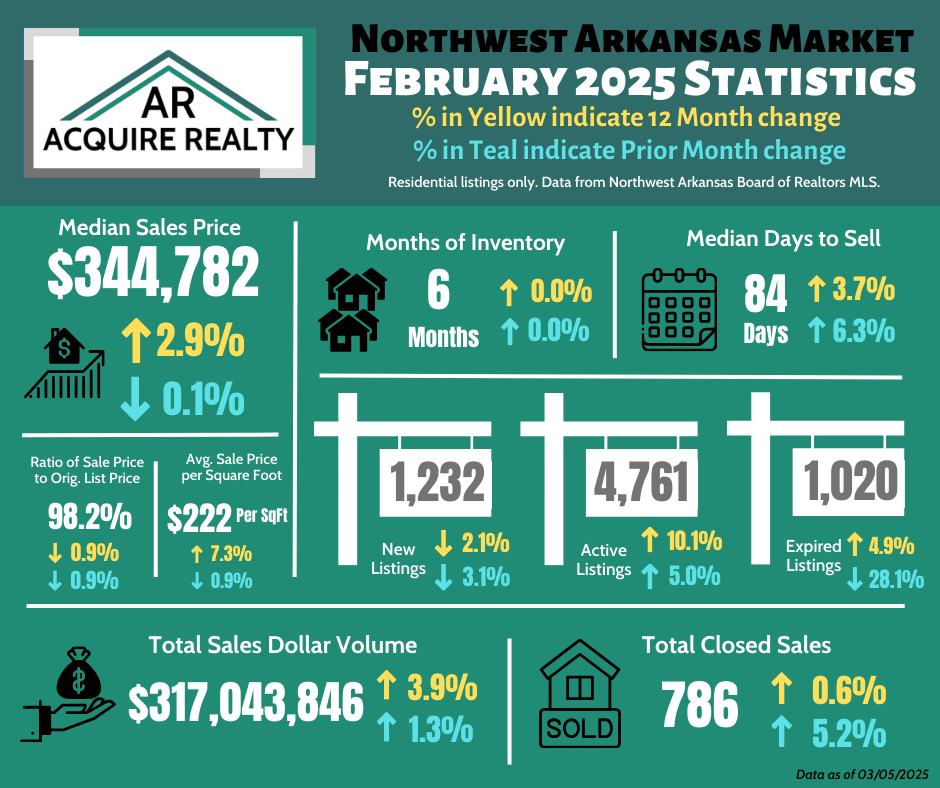
Latest NWA Market Statistics are here! 

February was pretty calm overall for the residential real estate market. There was still good activity level for NWA without large fluctuations. In fact, the only 2 statistics with double digit changes were: 10.1% increase in 1-year change in active listings (more sellers this February than last year) and 28.1% increase in 1-month change in expired listings (less sellers “giving up” on the market).
The main things worth pointing out are:
--- > The median sales price was down only 0.1% (or $168) from last month. This metric has stayed between $344K to $346K for 4 of the last 5 months; a welcomed sign of consistency.
--- > This was the first time the ratio of sale price to original list price fell below 99% since January of last year (98.7%). Although the 98.2% ratio for last month is still an indicator sellers aren’t having to make large concessions yet.
--- > Median days to sell was 84 days for February. That is the highest in 6 years; back in February 2019 when it was 91 days. That dates back to pre-pandemic months. In fact, only 3 months during that 72-month span had median days to sell over 80 (Feb 2024 at 81 days, Jan 2020 at 80 days, and March 2018 at 80 days).
--- > Months of inventory held at 6 again for the second month in a row. This matches the same pattern for Jan/Feb of 2024; which were both 6 as well.
If we were to narrow the discussion of last month down to one thing, stability would be the theme. In inflationary and/or uncertain times, stability is a relief to have one less thing changing quickly under your feet. If you have any questions about anything real estate, reach out!