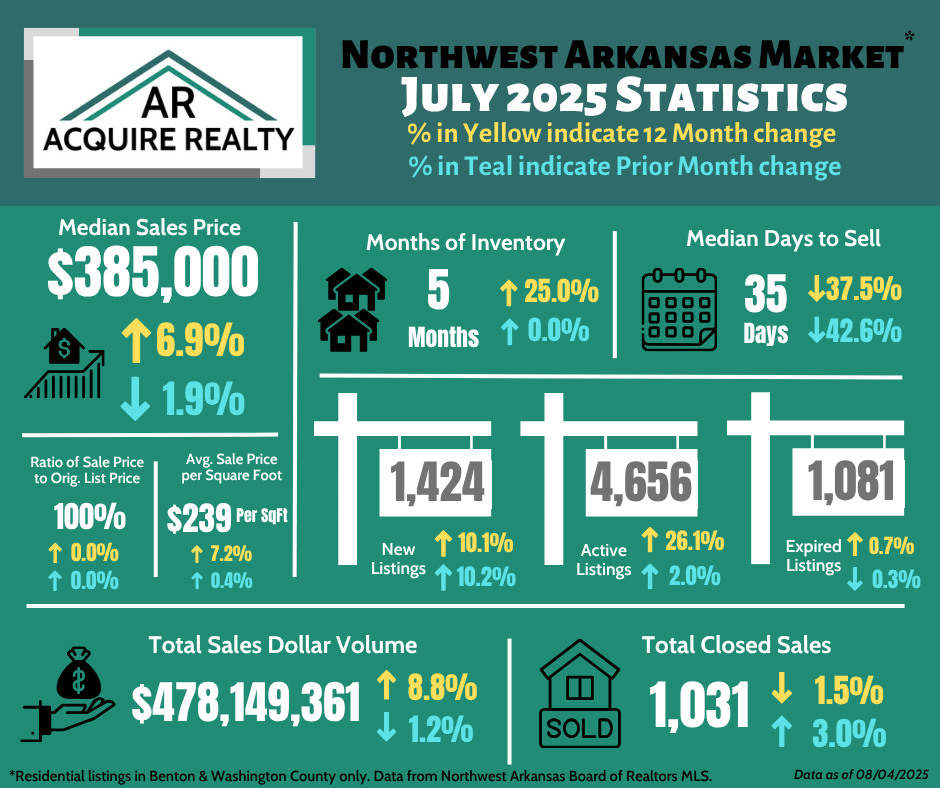
July was another strong month for NWA! 😎
From a pricing standpoint, sale price patterns are staying relatively consistent; with single digit percentage increases in 12-month changes and marginal increases in 1-month percentage changes. Interestingly enough, only 1 time in the last 55 months has the 12-month change decreased for price per square foot (May 2024, -2.28%) and median sale price (March 2024, -1.68%). Proof the market is increasing as a whole year-over-year.
In terms of listings in the market, the 26.1% jump in 12-month change for active listings is a relatively large increase in Julys in the last 5 years, but the 1-month change is still right in line with Julys of previous years. You might question if this is a small sign that sellers are having a harder time finding buyers, but that doesn’t seem to be the case with months of inventory staying in the 4 to 5 months range consistently. We would use days to sell to help form the analysis, but we think the July days to sell is incorrect. According to the NWA MLS data, the median days to sell was 35 for July. We suspect there is an error in the data somewhere. This would mean there was a 42.6% decrease from last month in days to sell (meaning buyers are all the sudden moving very fast which we haven’t seen any anecdotal signs of), and seems unlikely. We would expect us to be in the high 50’s or low 60’s days given we have been above 50 days to sell since Feb of 2023. In fact, 34 days to sell would be the lowest in the last 10 years; including the very fast-pace COVID times. We think there will be a correction in the data next month.
Over market sale was in line with this time of year; with only single digit percentage changes in 12-month and 1-month changes for total sales volume and total closed sales. If we are looking for signs of market slow down, both of these numbers would be slumping. We’ll continue to remain optimistic, but always monitoring for signs of market changes.