 NEW MARKET STATISTICS
 Before digging into the newest market statistics for NWA, it is important to first note, a smaller, outside MLS has been incorporated into the Northwest Arkansas Board of Realtors (NABOR) MLS system as of last month. A similar situation that occurred recently when the greater Harrison area was incorporated into the NABOR MLS.
Generally speaking, this new region adds an average of an additional 2,370 active listings, 140 expired listings, 140 new listings, 120 closed transactions, and about $23M more dollars in sales per month. The new area has lower priced homes, and thus decreases the overall median sales price of a house by about $11,600. That said, we caution readers from comparing prior market statistics updates with any future market statistics posts, as it is like comparing apples to oranges.
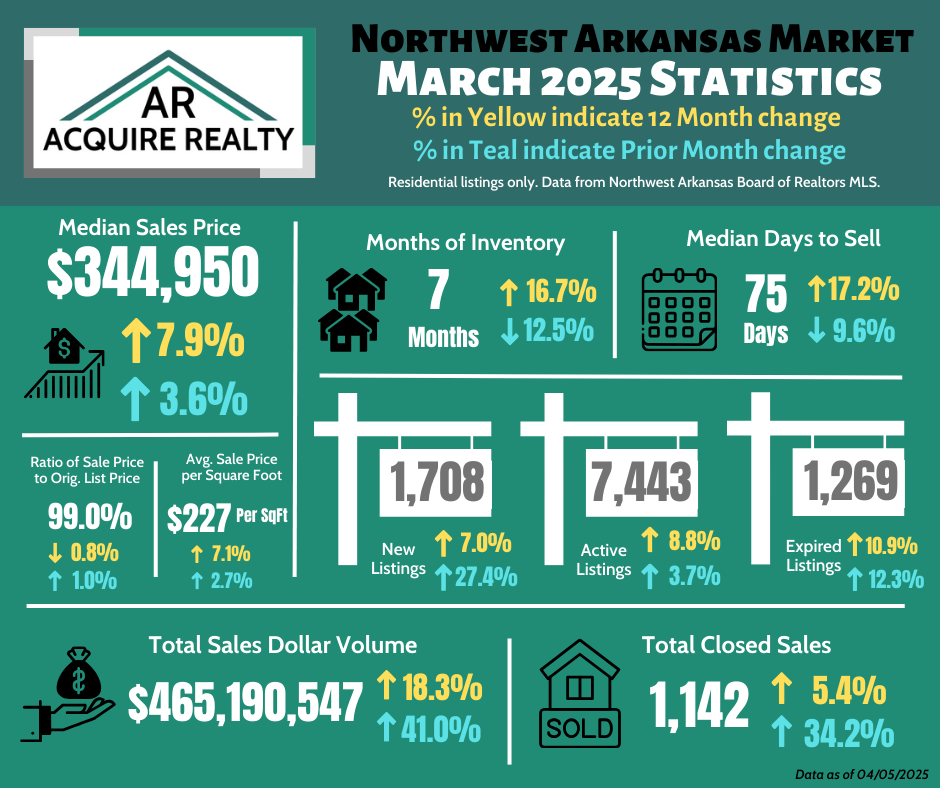
Now into the numbers for March 2025… It was another respectable month for the residential market in NWA. New listings increased 27% from February and the days on market went down by 8 days from last month. Both are typical signs that the market is waking up from the winter slow down.
The median sales prices and average price per square foot for a home was up slightly from last month; as well as, last year. The ratio of sales price to original list price was also up slightly from last month. All three of these statistics indicate sellers still have the upper hand in the market.
Total sales, both by count and by dollar amount, are up significantly from last month. That is, total sales volume was up 41% with $135M more closed dollars; and total number of closed transactions was up 34% with just shy of 300 more closings. Both of these metrics are also up from a 12-month change, showing there is still strong activity on the NWA residential market.
One final note to leave on. We have all heard chatter of recession talk. We resist predicting anything, but we will share a few insights on what we will look for from the data in future updates as signs of market slow down. We would watch for large decreases in the 12-month changes in total closed transactions; showing consistent underperforming of last year. We would also look for increases in months of inventory, days to sell, active listing, and expired listings; all signs fewer buyers are participating in the market. We would also expect to see the ratio of sales price to original list price decrease as sellers are forced to lower prices to find buyers.
That’s all for now. If you have questions about real estate (including commercial real estate) don’t hesitate to reach out!