


 April 2026 Market Statistics!!
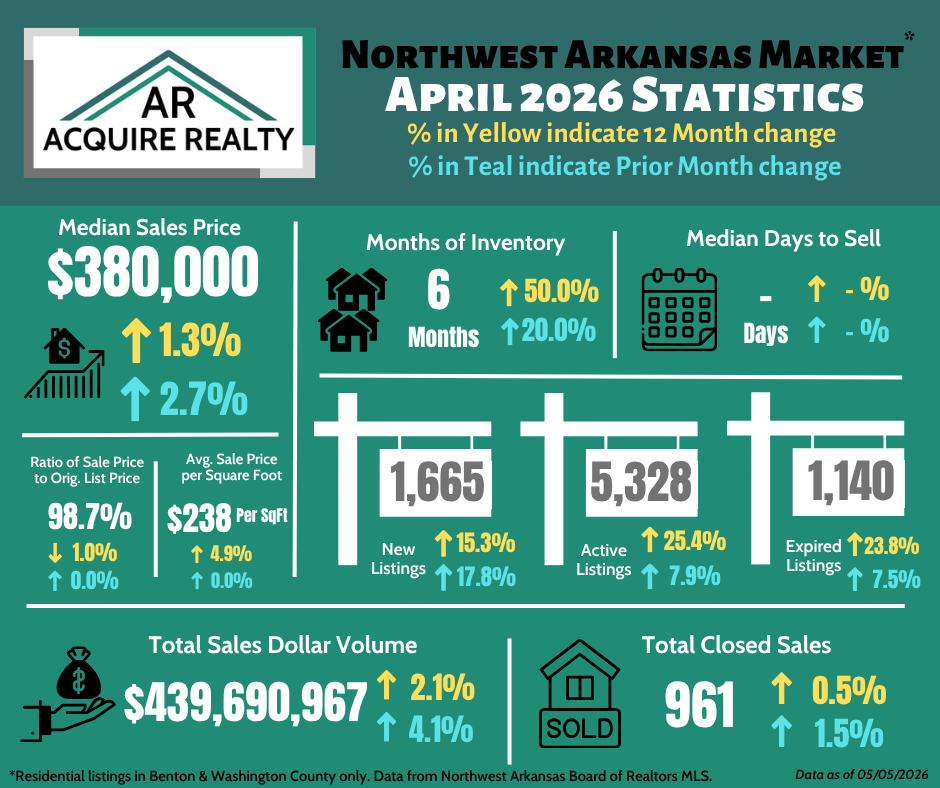
 The two biggest takeaways from the April statistics is that 1) pricing and sales have been consistent and 2) the listing activity is up. Let’s break these down.
Pricing statistics (median sales price, sales price per square foot, and ratio of sales price to original list price) all had minor percent changes from the prior month, as well as, the prior 12 months for all these metrics. Total sales, both by dollars and by count, also had increases less than 5% for 1-month changes and 12-month changes. All of these are signs that pricing and sales have been relatively stable over the last year.
In terms of listing activity, all three categories tracked (new listings, active listings, expired listings) were up at least 7% from March and up 15% or 20%+ from April of last year. This is an indication that the overall activity of sellers in the market is up. This is also reflected in the 1-month increase for Months of Inventory (MOI) from last month. Having 6 MOI and 98.7% sales price to original list price both indicate we are still in a seller’s market.
Broadly speaking, the market is up. That’s good from an overall economic viewpoint of our area. Buyers are probably also happy to see prices are only increasing by marginal amounts. We’re entering the busiest time of the year, so we will hopefully continue to see the strong residential market numbers for NWA.